Debugging ExactTarget Web Service Errors
September 15, 2014
Debugging ExactTarget Web Services errors is not an exact science. The error information available while debugging a web service call is either too generic or non-existent. Furthermore, the ExactTarget documentation on error codes never matched the error codes I received (except the generic 2: UnexpectedError). However, the raw SOAP envelope returned from ExactTarget often contains information helpful for diagnosing errors.
When you make a call to ExactTarget from an ASP.Net website, you can capture the SOAP request and response by adding the following lines to your web.config:
<system.diagnostics>
	<trace autoflush="true" />
	<sources>
		<source name="System.ServiceModel.MessageLogging" switchValue="Warning, ActivityTracing">
			<listeners>
				<add name="ServiceModelMessageLoggingListener">
					<filter type=""/>
				</add>
			</listeners>
		</source>
	</sources>
	<sharedListeners>
		<add initializeData="C:\temp\app_messages.svclog" type="System.Diagnostics.XmlWriterTraceListener, System, Version=2.0.0.0, Culture=neutral, PublicKeyToken=b77a5c561934e089" name="ServiceModelMessageLoggingListener" traceOutputOptions="Timestamp">
			<filter type=""/>
		</add>
	</sharedListeners>
</system.diagnostics>
<system.serviceModel>
	<diagnostics>
		<messageLogging logMessagesAtTransportLevel="true" logMessagesAtServiceLevel="false" logMalformedMessages="true" logEntireMessage="true" maxSizeOfMessageToLog="65535000" maxMessagesToLog="500" />
	</diagnostics>
</system.serviceModel>
This can be added anywhere in the web.config configuration node. It can be added even if there already exists a system.serviceModel or system.diagnositcs node but you wouldn't want to duplicate the logging. Make sure to change the path, C:\temp\, to a directory that is writable by the website.
Once your website is configured and running, you'll want to execute a call to the ExactTarget web service. After the call is finished, check the appropriate directory for the app_messages.svclog file. You can double-click the file to open it if you have SvcTraceViewer.exe installed (comes with several different packages). If you don't have SvcTraceViewer, you can get it from the Windows SDK.
Find the SOAP message in the Microsoft Service Trace Viewer (SvcTraceViewer.exe) by selecting the last item in the Activity tab. The central workspace will then show the associated Message Log Traces. See the screenshot below of the message log traces from a Create request for a DataExtensionObject.
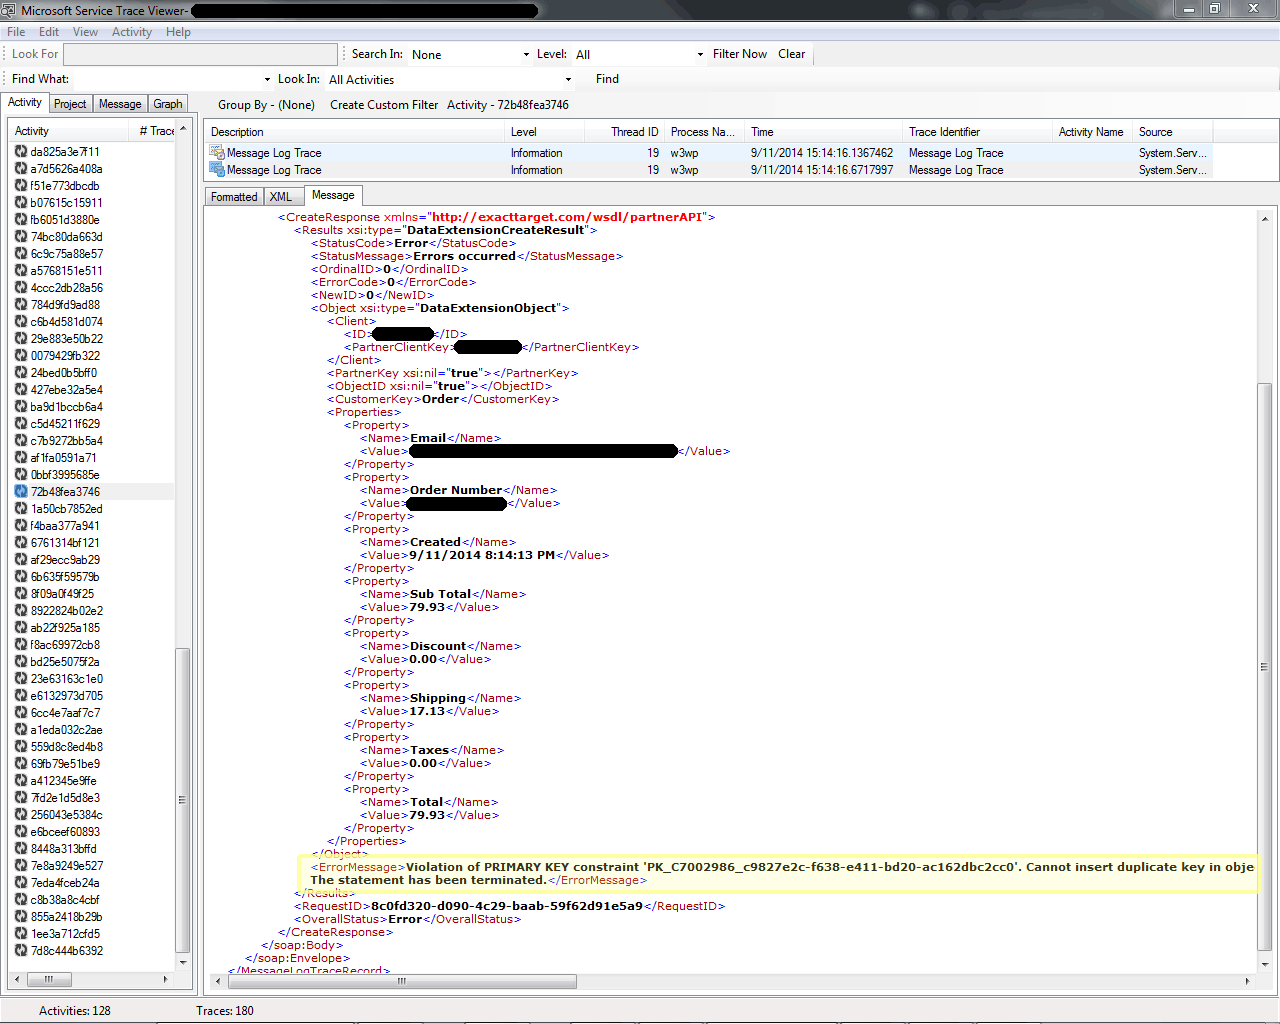
I selected the second Message Log Trace in the example above and the Message tab to see the response SOAP envelope from ExactTarget. Notice the generic StatusCode, StatusMessage, and ErrorCode. However, highlighted in the screenshot is the ErrorMessage that indicates there has been a Primary Key violation.
Synopsis
The raw SOAP envelope returned by ExactTarget can help you diagnose web service issues. However, it doesn't always contain enough helpful information to fix an issue. I've noticed that ExactTarget will reject e-mail addresses that have been repeated in a lot of tests or contain the word test. In these cases, there is very little information included as to why the web service had an error and it typically returns the generic error 2: UnexpectedError.